Git&黑马就业数据平台-day03
数据看板-函数抽取
方便后续编码,每一个图表对应一个函数
需求:
- 首页每个区域的渲染,都抽取一个函数
- 在
getData中调用并通过参数传递数据
核心步骤:
- 抽取函数
- 调用并传递数据
关键代码:
index.js
// 渲染顶部数据的函数
function renderOverview(overview) {
  Object.keys(overview).forEach(key => {
    // console.log(key)
    document.querySelector(`.${key}`).innerText = overview[key]
  })
}

// 首页-统计数据
async function getData() {

  // 使用拦截器的写法(只保留核心逻辑即可)
  const res = await axios({
    url: '/dashboard',
  })
  // 通过解构语法,简化数据取值
  const { overview, year, salaryData, groupData, provinceData } = res.data

  // 调用函数-渲染顶部数据
  renderOverview(overview)
}

getData()
git记录:
git add .
git commit -m"数据看板-函数抽取"
数据看板-薪资走势
逐步完成薪资走势
需求:
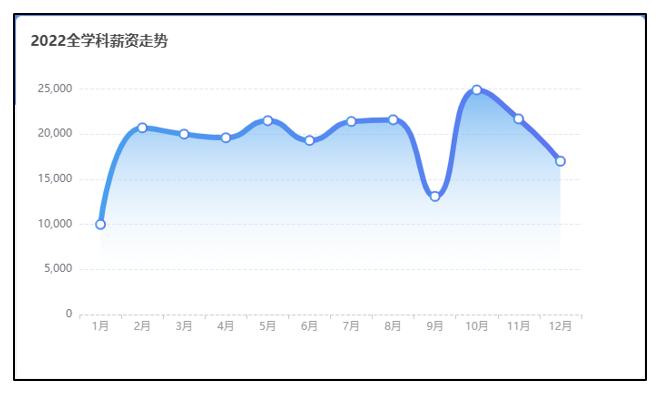
核心步骤:
整合到项目
调整设置,依次调整:
title
grid
yAxis
const option = {
  title: {
    text: '',// 文本
    left: '',// 左侧距离
    top: '' // 顶部距离
  },
  grid: {
    top: ''// 顶部距离
  },
  yAxis: {
    splitLine: {// 分割线
      lineStyle: {// 样式
        type: '' // 类型
      }
    },
  }
}
xAxis
const option = {
  xAxis: {
    axisLine: {// 轴线
      lineStyle: {// 样式
        color: '',// 颜色
        type: ''// 类型
      }
    },
    data: []// 数据
  },
}
series
const option = {
  series: [
    {
      data: [],// 数据
      symbolSize: '',// 标记尺寸
      lineStyle: {// 样式
        width: '',// 宽度
      },
      areaStyle: {// 区域样式
        color:''// 颜色
      },
      lineStyle: {// 线样式
        color:''// 颜色
      }
    }
  ]
}
渐变色
如果要设置渐变色使用如下代码即可,关键位置见注释
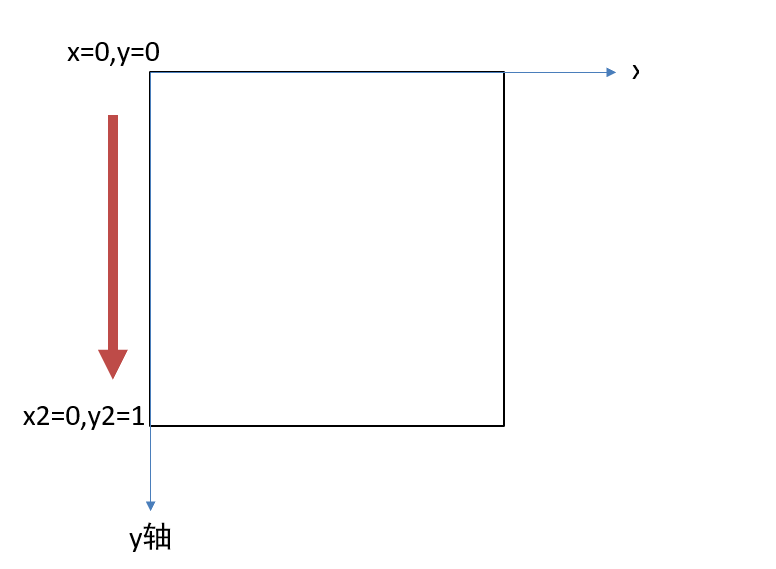
// x0, y0, x2, y2, 范围从 0 - 1,相当于在图形包围盒中的百分比
// 坐标轴如下图,原点在左上角
//  x轴: 从左往右(0-1)
//  y轴: 从上往下(0-1)
{
  type: 'linear',// 类型
  x: 0,
  y: 0,// x,y是起始点
  x2: 0,
  y2: 1,// x2,y2是结束点,从起点指向结束点就是方向
  // 如果要添加颜色,往下面数组添加即可
  colorStops: [{
      offset: 0, color: 'red' // 0% 处的颜色
  }, {
      offset: 1, color: 'blue' // 100% 处的颜色
  }],
  global: false // 缺省为 false
}
关键代码:
index.js
// 渲染薪资走势
function renderYearSalary(year) {
  // console.log(year)

  // 初始化ECharts实例
  const dom = document.querySelector('#line')
  const myChart = echarts.init(dom)

  // 定义选项和数据
  const option = {
    // 标题
    title: {
      text: '2022年薪资走势',
      // left,top分别设置,距离容器左侧和顶部的距离
      left: '12',
      top: '15'
    },
    // 绘图网络
    grid: {
      top: '20%'
    },
    // y轴
    yAxis: {
      // 坐标轴类型 value,连续数据
      type: 'value',
      // 调整分割线为虚线
      splitLine: {
        lineStyle: {
          type: 'dashed'
        }
      }
    },
    // x轴
    xAxis: {
      // 坐标轴类型,类目轴
      type: 'category',
      // 坐标轴轴线相关设置
      axisLine: {
        // 线段样式
        lineStyle: {
          // 线的类型
          type: 'dashed',
          // 线的颜色,修改之后,文字也会一起变色
          color: '#ccc'
        }
      },
      // 数据
      data: year.map(v => v.month)
      // data: ['Mon', 'Tue', 'Wed', 'Thu', 'Fri', 'Sat', 'Sun']
    },
    // 系列图表
    series: [
      {
        // 数据,随机的统计数据,每次刷新图表都可能不一样
        data: year.map(v => v.salary),
        // data: [820, 932, 901, 1200, 1290, 1330, 1320],
        // 标记的大小
        symbolSize: 10,
        // 线的样式
        lineStyle: {
          // 线宽
          width: 8,
          // 颜色
          color: {
            type: 'linear',
            x: 0,
            y: 0,
            x2: 1,
            y2: 0,
            colorStops: [{
              offset: 0, color: '#479dee' // 0% 处的颜色
            }, {
              offset: 1, color: '#5c75f0' // 100% 处的颜色
            }],
            global: false // 缺省为 false
          }
        },
        // 折线图
        type: 'line',
        // 平滑曲线,true开启
        smooth: true,
        // 区域填充样式
        areaStyle: {
          // 填充颜色
          // 线性渐变,前四个参数分别是 x0, y0, x2, y2, 范围从 0 - 1,相当于在图形包围盒中的百分比,如果 globalCoord 为 `true`,则该四个值是绝对的像素位置
          color:
          {
            type: 'linear',
            x: 0,
            y: 0,
            x2: 0,
            y2: 1,
            colorStops: [{
              offset: 0, color: '#b2d7f7' // 0% 处的颜色
            }, {
              offset: 1, color: 'rgba(255,255,255,0)' // 100% 处的颜色
            }],
            global: false // 缺省为 false
          }
        }
      }
    ],
    // 提示框
    tooltip: {
      // 如果要show生效,需要设置tooltip属性,默认就是显示
      show: true, // false隐藏
      // 触发方式坐标轴
      trigger: 'axis'
    }
  }

  // 基于选项和数据绘制图表
  myChart.setOption(option)
}

// 首页-统计数据
async function getData() {

  // 使用拦截器的写法(只保留核心逻辑即可)
  const res = await axios({
    url: '/dashboard',
  })
  // const overview = res.data.overview
  // 通过解构语法,简化数据取值
  // console.log(res)
  const { overview, year, salaryData, groupData, provinceData } = res.data

  // 调用函数-渲染顶部数据
  renderOverview(overview)

  // 调用函数-渲染薪资走势
  renderYearSalary(year)
}
git记录:
git add .
git commit -m"数据看板-薪资走势"
数据看板-薪资分布
薪资分布
需求:
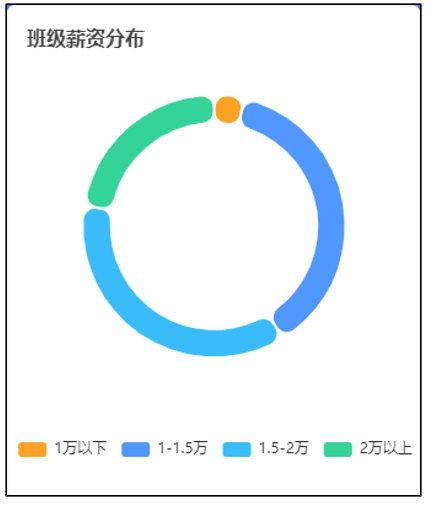
核心步骤:
整合到项目
调整设置,依次调整:
title
const option = {
  title: {
    left: '',
    top:''
  },
  series: [
    {
      name: '',// 名字,tooltip会用到
      type: '',// 类型
      radius: '',// 半径
      itemStyle:{},// 区域样式
      emphasis: {},// 高亮样式
      label: {},// 文本
      labelLine:{},// 文本引导线
      avoidLabelOverlap: '',// 避免重叠
      data:[] // 数据
    }
  ],
  color:[]// 调色盘
}
series
color
关键代码:
index.js
// 渲染薪资分布函数
function renderSalary(salaryData) {
  // console.log(salaryData)

  // 初始化实例
  const dom = document.querySelector('#salary')
  const myChart = echarts.init(dom)

  // 定义属性和数据
  const option = {
    title: {
      text: '班级薪资分布',
      left: 10,
      top: 15
    },
    tooltip: {
      trigger: 'item'
    },
    legend: {
      // top: '5%',
      // 离容器下侧的距离
      bottom: '5%',
      left: 'center'
    },
    series: [
      {
        name: '班级薪资分布',
        // type=pie 饼图
        type: 'pie',
        // 数组的第一项是内半径,第二项是外半径
        radius: ['55%', '70%'],
        // 图形样式
        itemStyle: {
          // 半径
          borderRadius: 15,
          // 颜色
          borderColor: '#fff',
          // 粗细
          borderWidth: 2
        },
        // 高亮状态的扇区和标签样式
        // emphasis: {
        //   label: {
        //     show: true,
        //     fontSize: 100,
        //     fontWeight: 'bold'
        //   }
        // },
        // 饼状图说明文本
        label: {
          show: false,
          // show: true,
          // position: 'center'
        },
        // 说明文本的指引线
        labelLine: {
          show: false
          // show: true
        },
        // 是否启用防止标签重叠策略,默认开启
        // avoidLabelOverlap: false,
        data: salaryData.map(v => {
          return {
            value: v.g_count + v.b_count,
            name: v.label
          }
        })
        //   [
        //   { value: 1048, name: 'Search Engine' },
        //   { value: 735, name: 'Direct' },
        //   { value: 580, name: 'Email' },
        //   { value: 484, name: 'Union Ads' },
        //   { value: 300, name: 'Video Ads' }
        // ]
      }
    ],
    // 颜色
    color: ['#fda224', '#5097ff', '#3abcfa', '#34d39a']
  }

  // 根据属性和数据绘制图表
  myChart.setOption(option)
}

// 首页-统计数据
async function getData() {

  // 使用拦截器的写法(只保留核心逻辑即可)
  const res = await axios({
    url: '/dashboard',
  })
  // const overview = res.data.overview
  // 通过解构语法,简化数据取值
  // console.log(res)
  const { overview, year, salaryData, groupData, provinceData } = res.data

  // 调用函数-渲染顶部数据
  renderOverview(overview)

  // 调用函数-渲染薪资走势
  renderYearSalary(year)

  // 调用函数-渲染薪资分布
  renderSalary(salaryData)

}
git记录:
git add .
git commit -m"数据看板-薪资分布"
数据看板-每组薪资
数据看板-每组薪资
需求:
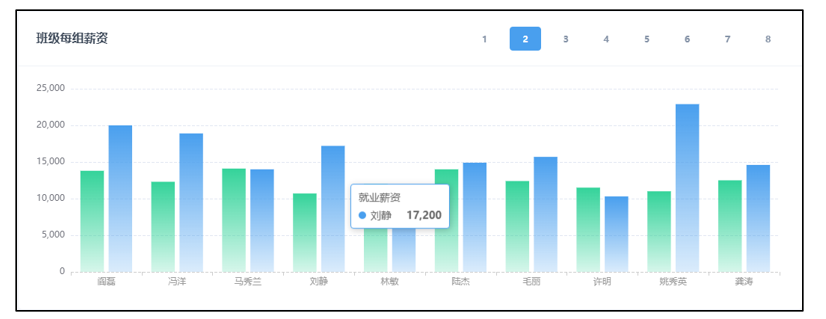
核心步骤:
找示例,并调整部分设置
const option = {
  tooltip: {},// 显示提示框
  xAxis: {
    axisLine: {// 轴线样式
      lineStyle: {
        color: '',
        type: ''
      }
    }
  },
  yAxis: {
    splitLine: {// 分割线样式
      lineStyle: {
        type: ''
      }
    }
  }
}
整合到项目
调整设置,依次调整:
grid
xAxis
const option = {
  grid: {
    left: 70,
    top: 30,
    right: 30,
    bottom: 50,
  },
  xAxis: {
    data: [],
    // 单独设置文字颜色,默认和轴线相同
    axisLabel: {
      color:'#999'
    }
  }
}
series: 提供了标准色,就用标准色
const option = {
  series: [
    {
      name: '',
      data:[],
      itemStyle: {
        color: ''
      }
    }
  ]
}
  // 左侧0%颜色   #34D39A
  // 左侧100%颜色 rgba(52,211,154,0.2)
  // 右侧0%颜色   #499FEE
  // 右侧100%颜色 rgba(73,159,238,0.2)
切换效果: 调用
setOption方法即可重新渲染,修改了option之后,图形也会随之更改- 点击之后,切换高亮
- 获取对应组数组
- 调用
setOption完成渲染
关键代码:
// 渲染每组薪资函数
function renderGroupSalary(groupData) {
  // console.log(groupData)

  // 初始化实例
  const dom = document.querySelector('#lines')
  const myChart = echarts.init(dom)

  // 定义选项和数据
  const option = {
    // 显示提示框
    tooltip: {},
    // 绘图网络
    grid: {
      left: 70,
      top: 30,
      right: 30,
      bottom: 50
    },
    xAxis: {
      type: 'category',
      // data: ['Mon', 'Tue', 'Wed', 'Thu', 'Fri', 'Sat', 'Sun'],
      // 默认渲染第一组的数据
      data: groupData[1].map(v => v.name),
      // 线的类型,颜色,文字的颜色
      axisLine: {
        lineStyle: {
          color: '#ccc',
          type: 'dashed'
        }
      },
      // 坐标轴刻度标签的相关设置
      axisLabel: {
        // 刻度标签文字的颜色
        color: '#999'
      }
    },
    yAxis: {
      type: 'value',
      // 分割线的类型
      splitLine: {
        lineStyle: {
          type: 'dashed'
        }
      }
    },
    // series中设置多个图形,就会渲染多个图形
    series: [
      {
        name: '期望薪资',
        // data: [120, 200, 150, 80, 70, 110, 130],
        data: groupData[1].map(v => v.hope_salary),
        type: 'bar',
        // 柱状图的样式
        itemStyle: {
          // 柱状图的颜色
          color: {
            type: 'linear',
            x: 0,
            y: 0,
            x2: 0,
            y2: 1,
            colorStops: [{
              offset: 0, color: '#34D39A' // 0% 处的颜色
            }, {
              offset: 1, color: 'rgba(52,211,154,0.2)' // 100% 处的颜色
            }],
            global: false // 缺省为 false
          }
        }
      },
      {
        name: '实际薪资',
        // data: [120, 200, 150, 80, 70, 110, 130],
        data: groupData[1].map(v => v.salary),
        type: 'bar',
        // 柱状图的样式
        itemStyle: {
          // 柱状图的颜色
          color: {
            type: 'linear',
            x: 0,
            y: 0,
            x2: 0,
            y2: 1,
            colorStops: [{
              offset: 0, color: '#499FEE' // 0% 处的颜色
            }, {
              offset: 1, color: 'rgba(73,159,238,0.2)' // 100% 处的颜色
            }],
            global: false // 缺省为 false
          }
        }
      }
    ]
  }

  // 基于选项和数据绘制图表
  myChart.setOption(option)


  // 高亮切换
  const btns = document.querySelector('#btns')
  btns.addEventListener('click', (e) => {
    if (e.target.classList.contains('btn')) {
      // console.log('点了按钮')
      btns.querySelector('.btn-blue').classList.remove('btn-blue')
      e.target.classList.add('btn-blue')

      // 数据切换
      const index = e.target.innerText
      // console.log(index)
      const data = groupData[index]

      option.xAxis.data = data.map(v => v.name)
      option.series[0].data = data.map(v => v.hope_salary)
      option.series[1].data = data.map(v => v.salary)

      // 重新渲染
      myChart.setOption(option)
    }
  })

}

// 首页-统计数据
async function getData() {

  // 使用拦截器的写法(只保留核心逻辑即可)
  const res = await axios({
    url: '/dashboard',
  })
  // const overview = res.data.overview
  // 通过解构语法,简化数据取值
  // console.log(res)
  const { overview, year, salaryData, groupData, provinceData } = res.data

  // 调用函数-渲染顶部数据
  renderOverview(overview)

  // 调用函数-渲染薪资走势
  renderYearSalary(year)

  // 调用函数-渲染薪资分布
  renderSalary(salaryData)

  // 调用函数-渲染每组薪资
  renderGroupSalary(groupData)
}
git记录:
git add .
git commit -m"数据看板-每组薪资"
数据看板-男女薪资分布
数据看板-男女薪资分布
需求:
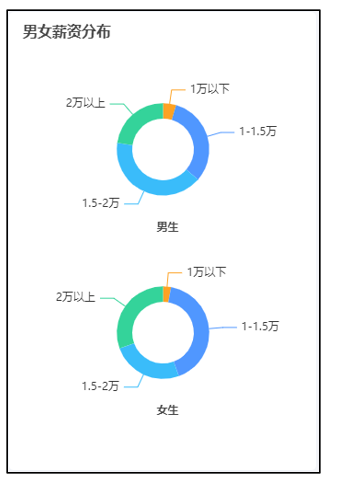
核心步骤:
找示例,顺表调整如下设置
legend:隐藏图例color: 调色盘title: 通过数组设置多个标题series: 通过数组设置多个图
整合到项目
调整设置,依次调整:
title: 根据提供好的位置直接设置
const option = {
  title: [
    {
      left: 10,
      top: 10,
      textStyle: {
        fontSize: 16
      }
    },
    {
      left: '50%',
      top: '45%',
      textStyle: {
        fontSize: 12
      }
    },
    {
      left: '50%',
      top: '85%',
      textStyle: {
        fontSize: 12
      }
    }
  ],
}
series: 根据提供好的位置和大小调整图形
const option = {
  series: [
    {
      radius: ['20%', '30%'],
      center: ['50%', '30%'],
      data: []
    },
    {
      radius: ['20%', '30%'],
      center: ['50%', '70%'],
      data: []    },
  ]
}
关键代码:
index.js
// 渲染男女薪资分布函数
function renderGenderSalary(salaryData) {
  // console.log(salaryData)

  // 初始化实例
  const dom = document.querySelector('#gender')
  const myChart = echarts.init(dom)

  // 定义选项和数据
  const option = {
    tooltip: {
      trigger: 'item'
    },
    // 不写legend 不会显示图例组件
    // legend: {
    //   top: '5%',
    //   left: 'center'
    // },
    // 颜色
    color: ['#fda224', '#5097ff', '#3abcfa', '#34d39a'],
    // 标题,通过数组设置多个
    title: [
      {
        text: '男女薪资分布',
        left: 10,
        top: 10,
        // text属性的样式
        textStyle: {
          // 文字的大小
          fontSize: 16
        }
      },
      {
        text: '男生',
        left: '50%',
        top: '45%',
        textStyle: {
          fontSize: 12
        },
        textAlign: 'center'
      },
      {
        text: '女生',
        left: '50%',
        top: '85%',
        textStyle: {
          fontSize: 12
        },
        textAlign: 'center'
      }
    ],
    series: [
      {
        type: 'pie',
        radius: ['20%', '30%'],
        // 饼图的中心(圆心)坐标,数组的第一项是横坐标,第二项是纵坐标
        center: ['50%', '30%'],
        data: salaryData.map(v => {
          return { value: v.b_count, name: v.label }
        })
        // data: [
        //   { value: 1048, name: 'Search Engine' },
        //   { value: 735, name: 'Direct' },
        //   { value: 580, name: 'Email' },
        //   { value: 484, name: 'Union Ads' },
        //   { value: 300, name: 'Video Ads' }
        // ]
      },
      {
        type: 'pie',
        radius: ['20%', '30%'],
        center: ['50%', '70%'],
        data: salaryData.map(v => {
          return { value: v.g_count, name: v.label }
        })
        // data: [
        //   { value: 1048, name: 'Search Engine' },
        //   { value: 735, name: 'Direct' },
        //   { value: 580, name: 'Email' },
        //   { value: 484, name: 'Union Ads' },
        //   { value: 300, name: 'Video Ads' }
        // ]
      }
    ]
  }

  // 基于选项和数据绘制图表
  myChart.setOption(option)
}

// 首页-统计数据
async function getData() {

  // 使用拦截器的写法(只保留核心逻辑即可)
  const res = await axios({
    url: '/dashboard',
  })
  // const overview = res.data.overview
  // 通过解构语法,简化数据取值
  // console.log(res)
  const { overview, year, salaryData, groupData, provinceData } = res.data

  // 调用函数-渲染顶部数据
  renderOverview(overview)

  // 调用函数-渲染薪资走势
  renderYearSalary(year)

  // 调用函数-渲染薪资分布
  renderSalary(salaryData)

  // 调用函数-渲染每组薪资
  renderGroupSalary(groupData)

  // 调用函数-渲染男女薪资分布
  renderGenderSalary(salaryData)
}
git记录:
git add .
git commit -m"数据看板-男女薪资分布"
作者:王江伟 创建时间:2024-07-17 14:23
最后编辑:王江伟 更新时间:2024-07-23 16:14
最后编辑:王江伟 更新时间:2024-07-23 16:14
